Whitcomb’s Area Rule
The area rule is the result of a series of experiments done by Dr. Richard Whitcomb, which was (even now) the most intuitive approach to one of the challenging problems in the field of aerodynamics.
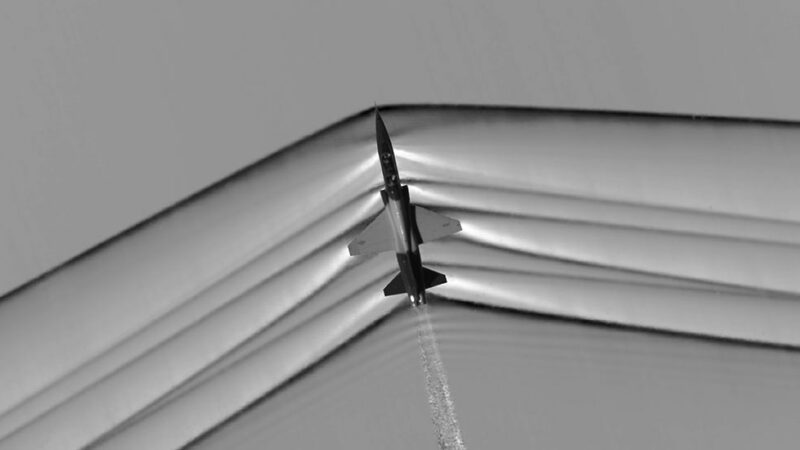
In a transonic flight, when the airspeed is close to the transonic range, the local airflow around some parts of the airplane, commonly in the upper surface of the wings, tends to reach Mach 1 easily. Such localized supersonic flows produce shockwaves, which significantly affect the performance of the aircraft by producing a form of a rapid increase in drag – called as the wave drag. The area rule is a very important rule that addresses this effect by minimizing any rapid changes in the longitudinal cross-sectional area of an aircraft by making appropriate design adjustments.
How does Whitcomb’s area rule work?
Whitcomb observed the shockwave formations from various wind tunnel models involving shapes that included wings and just the fuselage and the indented shape as shown below.
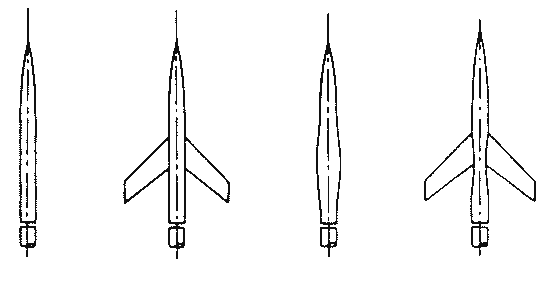
Whitcomb found that the drag was proportional to the discontinuity in the cross-sectional area throughout the length of the airplane. He concluded that the presence of wing adds an extra volume at that point and by indenting and reducing the volume of the fuselage it could lead to a smoother area distribution, which in turn would reduce the wave drag. The two shapes in the middle reflect the identical cross-sectional area distribution.
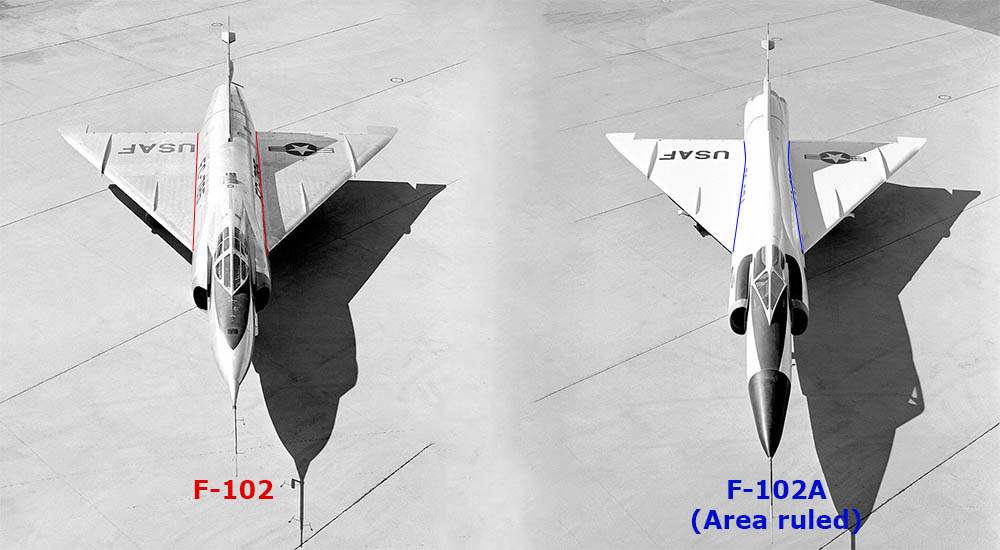
The very first application of the area rule was in the modification of the Convair F-102 Delta Dagger as F-102A. The F-102 performed poorly due to high wave drag and failed to achieve a supersonic flight. The aircraft was then redesigned as F-102A by reducing (indenting) the area of the fuselage at the waist, following Whitcomb’s area rule. The F-102A was later able to achieve Mach 1.22, with a considerable reduction in the transonic wave drag.
Here is a schematic cross-sectional area distribution plot for both the variants of the aircraft.
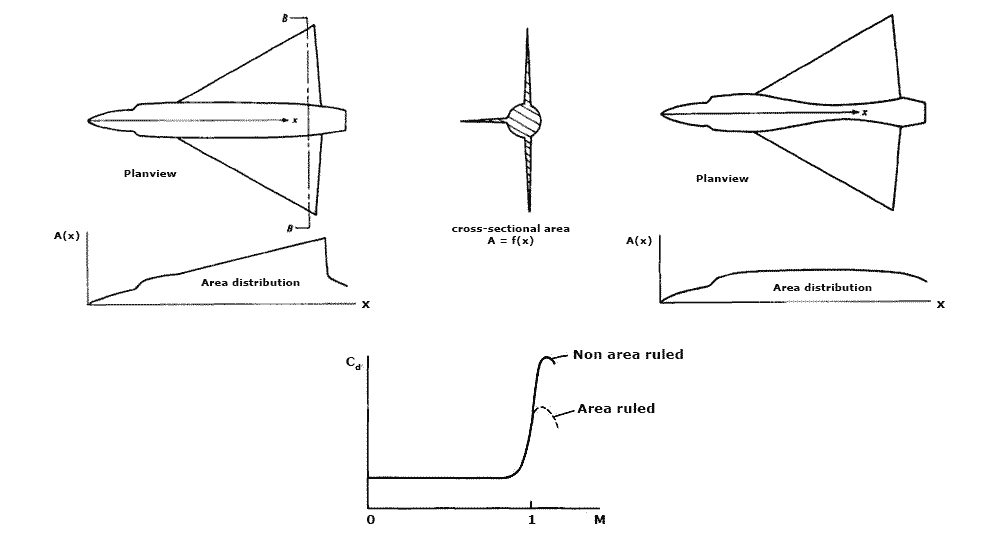
Note that the second plot on the right has a smoother distribution with respect to the contour where the fuselage is indented.
So by indenting the fuselage (reducing the volume of the fuselage) at the waist, the cross-sectional area is maintained as smooth as possible, providing almost a uniform and continuous area of smooth interaction to the airflow. Thus by doing this, one can achieve an area distribution close to a Sears-Haack body, which is the theoretical design for a fuselage with the lowest possible wave drag for a given volume.
However, the Whitcomb’s area rule is only good for reducing the wave drag due to the wings, and it doesn’t really get rid of all the wave drag anyway. Other forms of area ruling with configurations like the tail-mounted engines, specifically placed streamlined components are still implemented today. A very familiar example of this area ruling can be seen in the design of the Boeing 747 aircraft. The hump in the front is the result of applying the area rule to maintain a streamlined cross-sectional area for the near transonic flights. In the case of modern supersonic designs, as the engines turned more powerful, the area rule is less considered, mostly favoring the cost-efficiency in manufacturing.
In the upcoming editions, we will explore more about the drag reducing techniques that were developed based on the area ruling.

nice explanation
your article was very helpful, am a student in aero but to undergraduate level. can you tell me how did you draw those curves(area distribution curve)? like if i have a model( solidwork)and i want to plot that area distribution curve, is there an software that can help me?
The area distribution curve was taken from a book. Sorry, I don’t remember the name. If you want to plot an area distribution of a curve for a model, you can try breaking your model to its key planar sections. You can then plot the individual surface area of the planar sections against the longitudinal position of that point in an excel sheet. That way you can get the cross-sectional area distribution curve, similar to the model above.
Hello Arsene,
The cross sectional (frontal) area of aircraft normal to longitudinal axis and this at several stations along the aircraft longitudinal axis.
|
| . . . . .
a(x) | . . .
|._____________________________________
a0 a1 a2 a2 a4 a5 a6 a7 a8 ………..
a1, a2…. are station along aircraft longitudinal axis.
Interesting!